Top 100 Pharmaceuticals Companies Ranking 2026

All values are in USD Million

RankCompanyTotal Revenue 2025%Change (from 2024)EBIT/operating income 2025%Change (from 2024)Net Income%Change (from 2024)Total Assets 2025%Change (from 2024)R&D Expenses 2025%Change (from 2024)
1Janssen/ Johnson & Johnson1941930.06325810.952268040.90614665-0.149
2Roche1775100.017232800.377173870.502126886-0.01116824-0.128
3Eli Lilly1651790.447257311.029206400.9491124760.429133370.213
4Pfizer162579-0.0167520-0.0637771-0.032208160-0.02510437-0.036
5AbbVie1 611600.086150750.654233-0.0129096-0.289
6AstraZeneca1587390.086137430.374102330.4531140740.096142320.048
7Novartis1545320.084176440.213139670.171109490.085112000.118
8Bayer153323-0.022-1260-4235122313-0.0576750-0.071
9Sanofi1510420.0627422-0.12591860.397148363-0.04591750.061
10Novo Nordisk1494500.06420425-0.005163890.014868640.16683260.083
11Bristol-Myers Squibb146756-0.0329328705590038-0.0289951-0.108
12Abbott1443280.05780530.186524-0.513867130.06529420.034
13GlaxoSmithKine1437740.041106290.97384271.131818980.028100840.176
14Shanghai Pharmaceuticals Holdings Co1397010.0313920.2219760.188326410.054328-0.023
15CR Pharma Segment1377400.04616510.07913510.149164440.197
16China Resource Pharma Segment1377400.04616510.07913510.149400140.1093510.249
17Amgen1367510.190800.25177110.88590586-0.01472720.219
18Boehringer Ingelheim1324690.03674330.023
19Takeda2293220.07521930.6691-0.251
20Gilead Sciences, Inc. 1289150.011100225.03851016.7295902305799-0.018
21Fresenius1263880.04830360.04323340.14148433-0.049730-0.019
22Merck121102-0.0033601-0.0122615-0.06151527-0.00124150.06
23Teva1172580.04321571418407480.03610130.015
24CSL3155580.05141340.08431360.155394040.0361359-0.05
25Regeneron1143430.013578-0.10345050.021405590.07458500.14
26Viatris114300-0.03-2663-351537193-0.1049660.194
27Daiichi Sankyo2120720.17821240.56918930.474256350.15927900.194
28Vertex Pharmaceuticals1120010.08941733953256430.13839100.077
29Baxter Pharma1112440.057-308-95720055-0.222518-0.122
30Bausch Health1101560.06718130.17315726366-0.0066290.021
31Biogen198910.0221557-0.1831293-0.208294400.051779-0.102
32Zoetis Inc194670.02333600.07226730.075154670.0866980.017
33UCB190570.25822790.47118230.463212450.04721320.071
34Grifols188030.04314550.0435861.35223062-0.0794980.109
35Chugai Pharmaceutical Co., Ltd.280510.07539880.12128860.136129640.06511530.018
36Servier180260.162
37Organon1 6216-0.0293313-0.108187-0.784300.034
38Sun Pharma260600.09415280.2412140.141102320.0770.40.032
39Fosun Pharma158100.014382-0.0194720.217168020.0225620.101
40Yunnan Baiyao157660.0298450.0577210.08560830.018490.039
41 Eisai252830.046282-0.189259-0.15892740.0451016-0.075
42Galderma152070.1818290.2856131.654133930.062245-0.058
43Incyte151410.212151523.686128738.4569580.2782050-0.214
44Elanco147150.062-224-232133580.0593680.07
45Sino Biopharma144570.1039720.316744-0.1655892-0.0168210.153
46Jiangsu Hengrui Pharmaceuticals144280.1312190.21510800.21897810.39412210.06
47Ipsen143010.08115140.16611810.17681170.0778820.098
48STADA Arzneimittel AG143000.06
49Jazz Pharma142680.049-430-35611659-0.029783-0.115
50Octapharma142580.056750.0855300.02864670.0521370.088
51Perrigo Company Plc14253-0.028-1122-14258535-0.11595-0.15
52 Argenx142480.886105412920.55186830.413640.387
53Chiesi 142410.06210350.068
54 Lundbeck139410.1198440.6135110.0168329-0.0977830.088
55Pierre Fabre137440.046
56Genmab137200.19210650.096963-0.15128731.00716060.136
57Alnylam Pharma137140.65250231449660.17113200.172
58CSPC Pharma13641-0.104673-0.138543-0.10765730.0588130.119
59Aurobindo235940.0945630.1573870.09955310.10515-0.412
60Biontech133580.043-1229-132925727-0.0242463-0.066
61 Hikma133490.0717410.0315080.0256710.105
62 United therapeutics131830.10614930.08413350.11778800.075500.143
63Cipla231530.0717570.1575850.26941500.143170-0.022
64Ono23116-0.031382-0.626321-0.60868100.1659590.336
65 Sobi131060.08595-0.84652-0.8777418-0.106
66Recordati130640.1187850.055190.06561450.0233990.192
67Ferring129450.074196-0.12753-0.6724994-0.081418-0.03
68Celltrion1 28720.178061.3757121.462154110.061
69Neurocrine128610.2146190.0854790.40246320.24510160.389
70Neurocrine Biosciences128610.2146190.0854790.40246320.24510160.389
71Shionogi228050.00710020.02110850.05698260.0846950.058
72Dr. Reddy's226800.1858040.2495940.23242540.2612680.206
73Dainippon Sumitomo225530.2681841513350-0.189319-0.557
74Lupin225450.1384460.6583670.70832450.2171960.158
75Royalty Pharma123780.0515600.2071324-0.005196210.077452225
76Exelixis123200.078720.4437830.5012844-0.035825-0.094
77Orion122110.2257390.5165850.51723510.2342460.171
78Sarepta Therapeutics121980.156-700-7133350-0.15515220.892
79Hansoh Pharma121040.2269170.2887780.27155860.264700.243
80Moderna11944-0.399-2728-282212338-0.1283132-0.311
81Kedrion119310.046
82Santen11920-0.0063040.5892290.3432619-0.061154-0.052
83Zydus217570.3288270.7566420.67835900.342
84 Biocon2 16960.0344860.051113-0.00965320.04995-0.256
85Changchun Tech11692-0.103-3
86 Otsuka11580-0.89430680.48223440.055268640.12322580.123
87Keenova1 14310.32-348-49056290.704910.016
88Halozyme Therapeutics113970.376469-0.15317-0.28625250.224810.031
89Torrent Pharma212820.072970.1362120.1541665-0.005650.102
90Zhifei Bio11254-0.656-20614441-0.382131-0.087
91Ionis19440.338-382-38135240.1739160.016
92 Ascendis Pharma18430.98-249-26715240.104355-0.011
93Emergent BioSolutions1743-0.288100531319-0.05153-0.248
94Tianjin Pharmaceuticals Da Ren Tang Group Corp1688-0.327348-0.035296-0.047270.1696350.09
95 Gan& Lee Pharma15670.3311660.8741720.95117680.049910.196
96SK Biopharma14880.2911411.1171750.1168270.156
97PharmaMar12570.256651.521770.6355210.085
98CanSino Biologics11480.284641005-0.09844-0.248
99 Astellas2120.19230.4170.31.98221373-0.06420.114
100WuXi AppTec160.15831.052140.284148-0.055

  • [1] Year Ending December 2025
  • [2] Year Ending March 2025
  • [3] Year Ending June 2025

The Top 100 Pharmaceutical Manufacturing Companies Ranking 2026, published by ChemAnalyst, presents a comprehensive assessment of the world's leading pharmaceutical manufacturers based on their financial performance during the fiscal year 2025. The ranking serves as a benchmark for evaluating the competitive landscape of the global pharmaceutical industry by analyzing the financial strength, operational efficiency, innovation capabilities, and overall business performance of the industry's key players. As the pharmaceutical sector continues to evolve in response to changing healthcare demands, technological advancements, demographic shifts, and regulatory developments, this ranking provides valuable insights into the companies that have demonstrated exceptional resilience and sustained growth during the year.

The 2026 edition highlights the remarkable transformation taking place across the pharmaceutical industry. The year 2025 witnessed continued expansion in demand for innovative therapies, particularly in obesity, diabetes, oncology, immunology, rare diseases, and specialty medicines, while demand for COVID-19-related products continued to normalize. Companies with diversified product portfolios and strong innovative pipelines significantly outperformed peers that remained dependent on pandemic-related revenues. At the same time, increasing investments in biologics, gene therapies, precision medicine, and artificial intelligence-driven drug discovery continued to reshape the industry's long-term growth trajectory.

The ranking has been developed using publicly available financial statements and annual reports released by the respective companies for fiscal year 2025. To provide a holistic evaluation of corporate performance, ChemAnalyst analyzed five key financial indicators, namely Revenue, Operating Income, Net Income, Total Assets, and Research & Development (R&D) Expenditure. These parameters collectively reflect a company's commercial scale, operational efficiency, profitability, financial stability, and commitment to innovation. While revenue and profitability indicate market success and operational excellence, total assets demonstrate financial strength, whereas R&D expenditure highlights an organization's ability to sustain future growth through continuous product development and technological advancement.
Top Performers

ChemAnalyst has conducted a comprehensive analysis and ranking of companies based on their performance, considering key indicators such as Revenue, Business Operating Income, Net Income, Total assets, and R&D expenditure in 2026 compared to 2025.

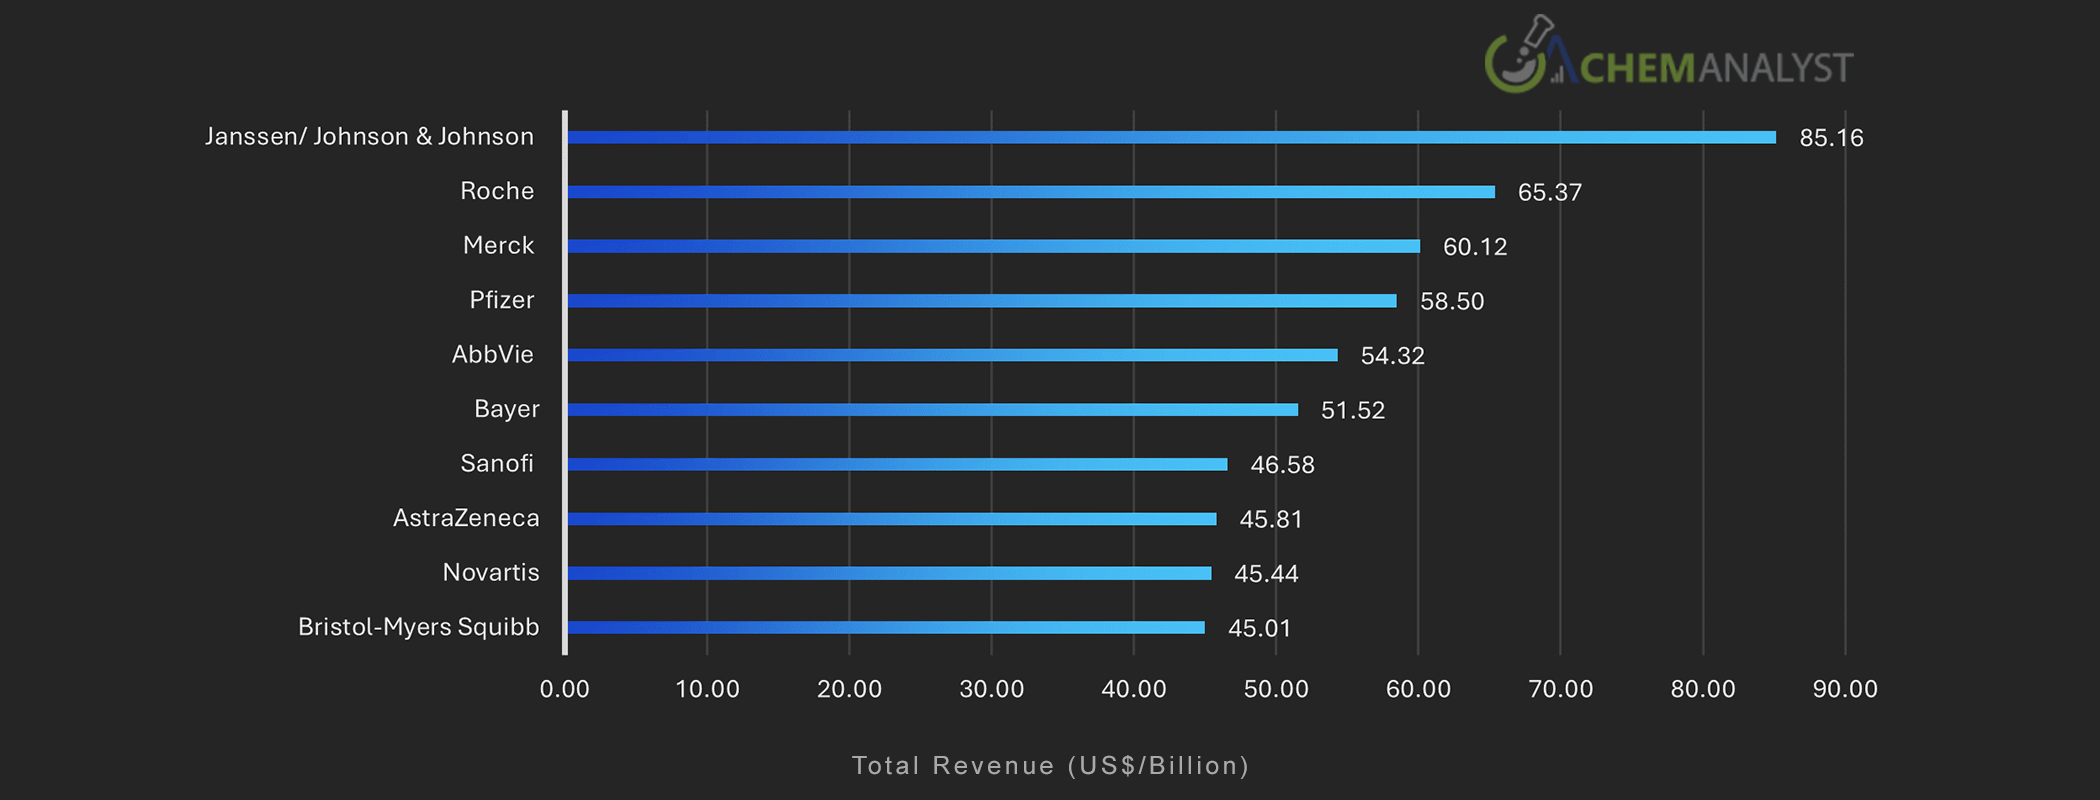
Top 10 Companies by Revenue

Top 10 Companies by Revenue

The global pharmaceutical industry continued to demonstrate strong financial resilience in 2025, supported by robust demand for innovative therapies, expanding biologics portfolios, increasing adoption of obesity and diabetes treatments, and continuous investments in research and development. Among the major pharmaceutical companies, Johnson & Johnson (J&J) remained the leading revenue generator, reporting annual sales of USD 94.2 billion, reflecting solid growth across its pharmaceutical and MedTech divisions. Eli Lilly emerged as one of the industry's strongest performers, recording a remarkable 45% increase in revenue to approximately USD 65.2 billion, primarily driven by exceptional demand for Mounjaro and Zepbound. Pfizer reported revenue of around USD 62.6 billion, although declining sales of COVID-19 products weighed on overall performance. Roche generated CHF 61.5 billion in revenue as strong demand for its pharmaceutical and diagnostic products offset macroeconomic challenges.

Similarly, AbbVie reported total revenue of USD 61.2 billion, supported by rapid growth in its immunology portfolio, particularly Skyrizi and Rinvoq. AstraZeneca generated USD 58.7 billion in revenue, driven by strong performances across oncology, cardiovascular, and rare disease segments, while Novartis recorded revenue of USD 54.5 billion, benefiting from continued expansion within its oncology portfolio. Bristol-Myers Squibb (BMS) generated USD 48.2 billion in revenue as growth in Opdivo and Yervoy partially offset declines in other therapeutic categories. Bayer and Sanofi reported annual revenues of EUR 45.6 billion and EUR 43.6 billion, respectively, while GSK generated GBP 32.7 billion through sustained growth in its respiratory, oncology, and HIV businesses. Gilead Sciences and Amgen reported revenues of USD 29.4 billion and USD 25.7 billion, respectively, whereas Novo Nordisk reported revenue of DKK 309.1 billion, driven by exceptionally strong demand for Ozempic, Wegovy, and Rybelsus. Overall, the sector benefited from favorable pricing strategies, expanding product pipelines, and increasing global healthcare expenditure.

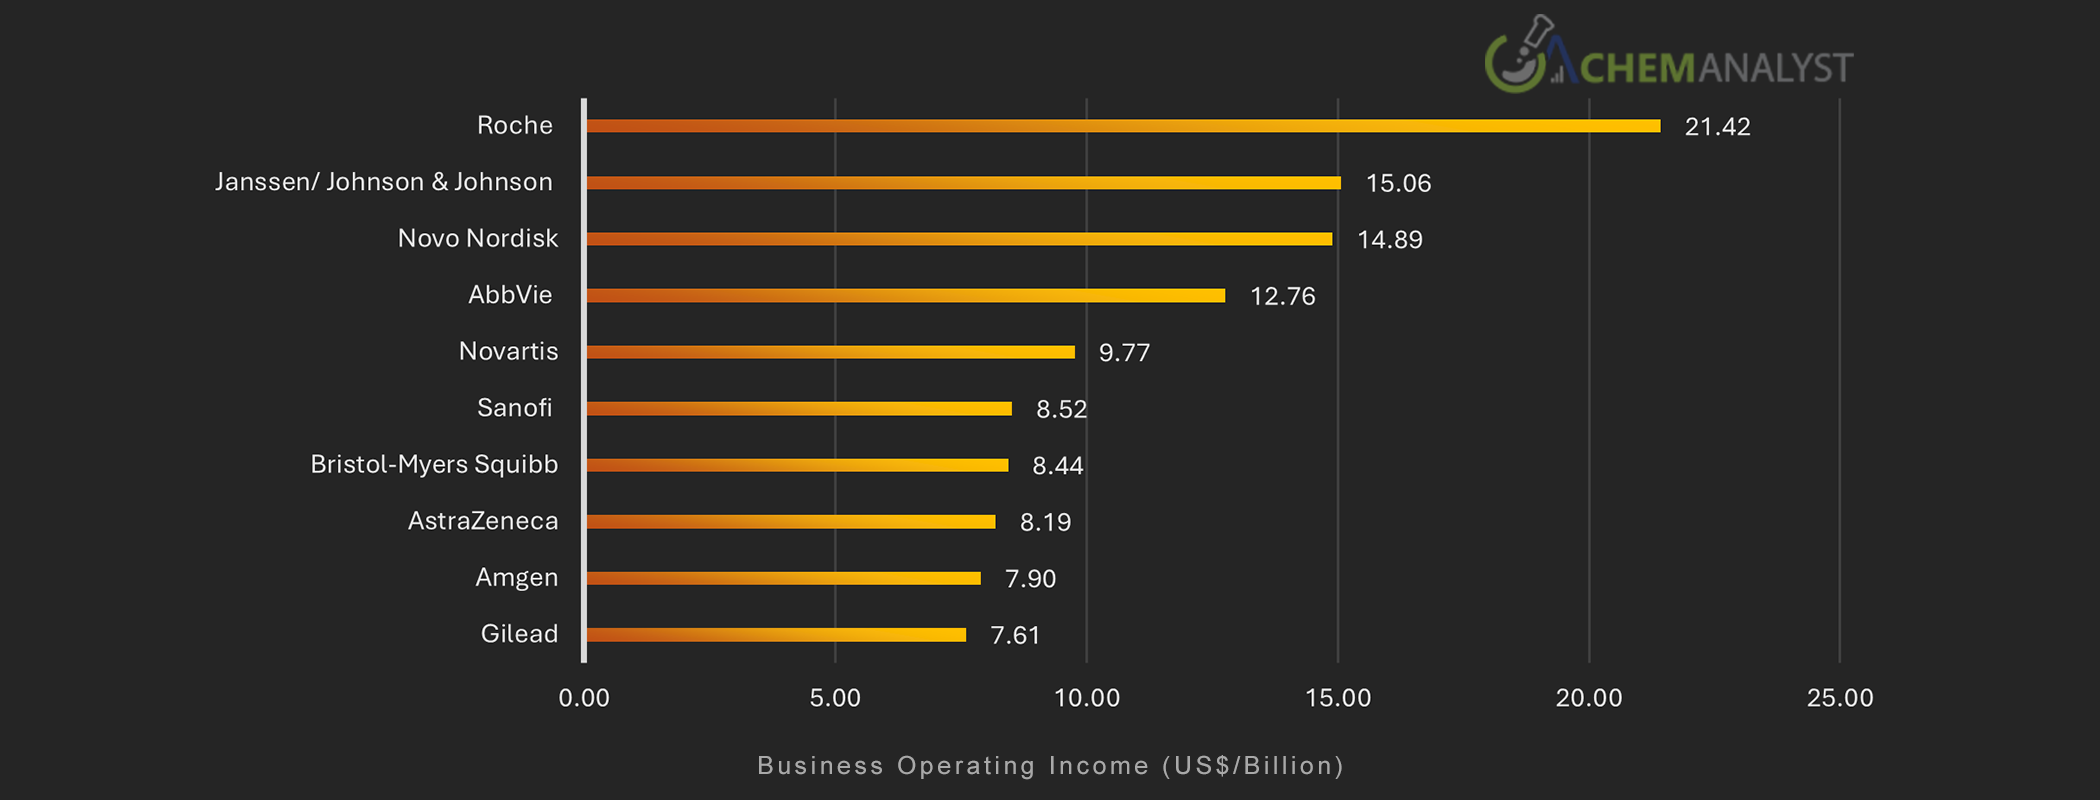
Top 10 Companies by Business Operating Income

Top 10 Companies by Business Operating Income

Operating profitability improved considerably across the pharmaceutical industry during 2025 as companies focused on improving manufacturing efficiency, optimizing supply chains, increasing production capacity, and implementing cost-control measures. Johnson & Johnson recorded the strongest performance among the companies considered, with operating income increasing to USD 32.6 billion, nearly doubling compared with the previous year as a result of stronger margins and favorable tax adjustments. Novartis generated operating income of USD 17.6 billion, benefiting from increased demand for high-value oncology products and improvements in operational efficiency. Amgen reported non-GAAP operating income of approximately USD 16.2 billion, while AstraZeneca generated operating income of USD 13.7 billion, supported by strong product sales and the absence of major one-time charges that had affected previous financial results.

Likewise, Sanofi reported business operating income of approximately EUR 12.1 billion, while Bayer recorded EBITDA before special items amounting to EUR 9.7 billion, although profitability remained under pressure because of portfolio restructuring costs and litigation-related expenses. GSK generated operating profit of GBP 7.9 billion, supported by lower legal expenses and higher royalty income. Novo Nordisk reported operating profit of DKK 127.7 billion, despite the negative impact of restructuring expenses. Meanwhile, Roche, Eli Lilly, and Gilead Sciences also recorded substantial improvements in operating profitability owing to higher sales volumes, favorable product mixes, and lower impairment charges. Overall, the pharmaceutical industry maintained strong operating margins as companies continued to prioritize high-value products and optimize cost structures.

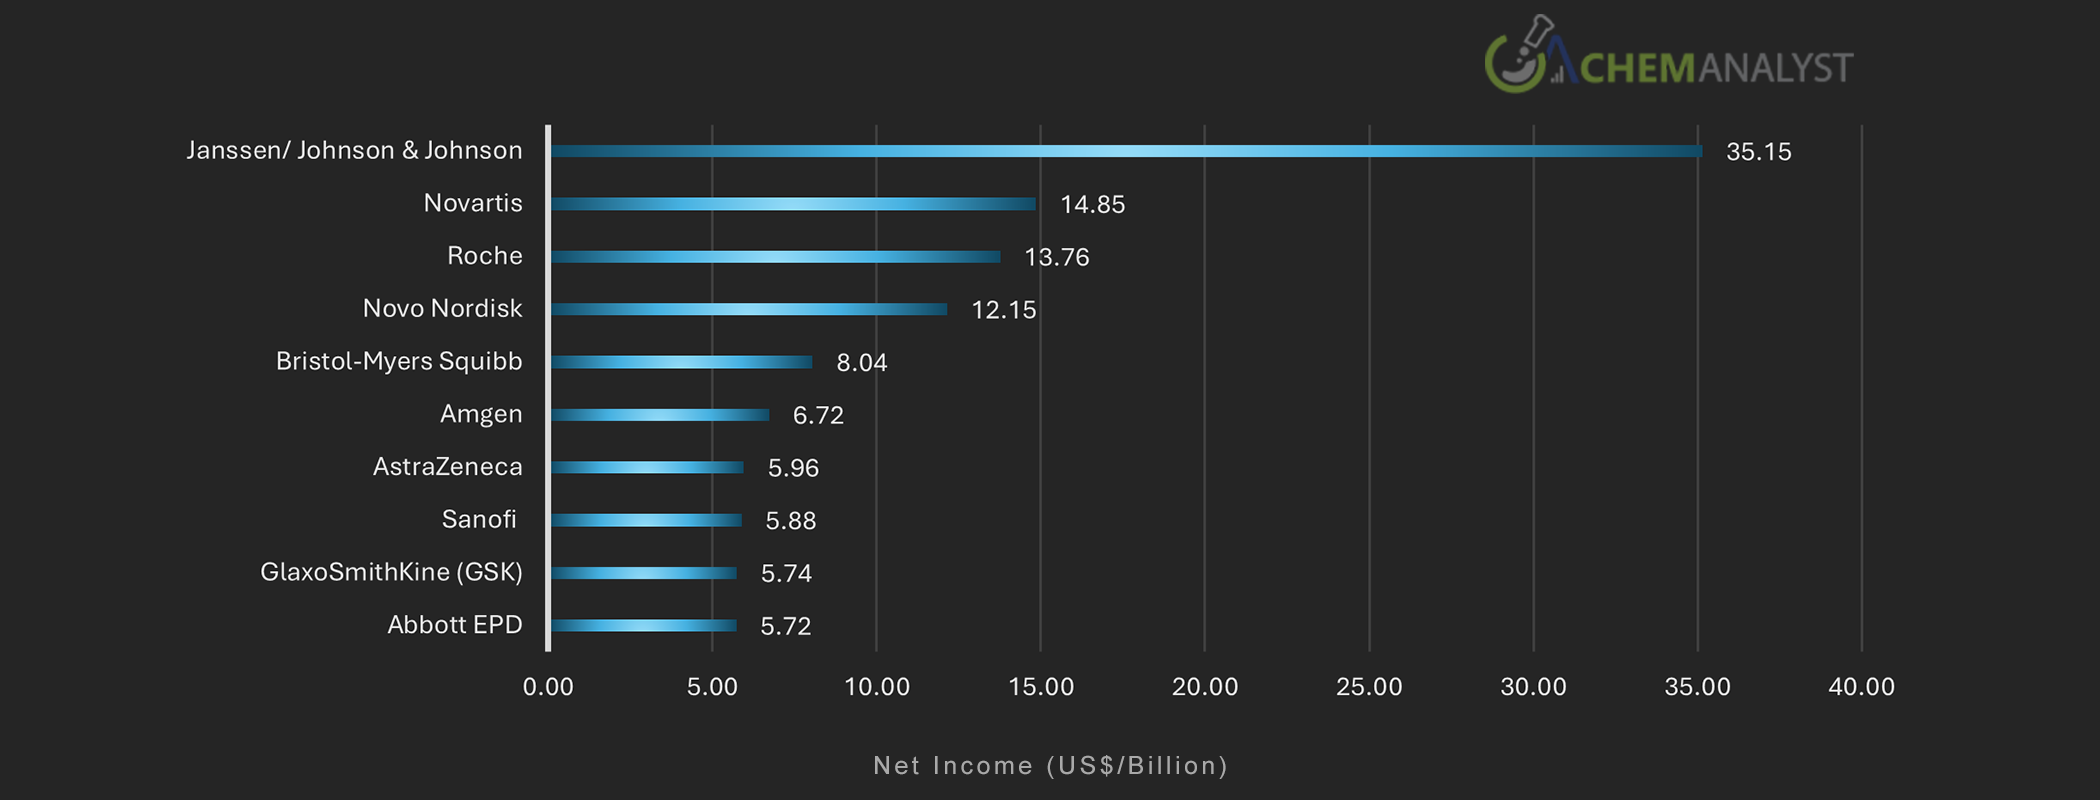
Top 10 Companies by Net Income

Top 10 Companies by Net Income

Most leading pharmaceutical companies reported significant growth in net earnings during 2025, reflecting strong revenue generation, improved operating efficiency, and the absence of major impairment charges that had negatively affected financial performance in previous years. Johnson & Johnson reported net income of USD 26.8 billion, representing an increase of more than 90% compared with the previous year. Eli Lilly reported net income of USD 20.6 billion, nearly doubling its profitability as sales of diabetes and obesity medications continued to surge. Novartis generated net earnings of approximately USD 14.0 billion, while Roche recorded net income of CHF 13.8 billion, supported by strong operational performance and reduced impairment expenses.

Similarly, Novo Nordisk reported net profit of DKK 104.4 billion, benefiting from increasing demand for its flagship products. AstraZeneca generated net earnings of USD 10.2 billion, while Sanofi reported net income of approximately EUR 7.8 billion. Pfizer, Bristol-Myers Squibb, Amgen, Gilead Sciences, and AbbVie recorded net profits of USD 7.8 billion, USD 7.1 billion, USD 6.8 billion, USD 4.1 billion, and approximately USD 4.1 billion, respectively. In contrast, Bayer reported a net loss of approximately EUR 3.6 billion, reflecting the continued financial impact of legal settlements and impairment charges. Although GSK did not disclose its exact net income figures, the company reported a substantial improvement in earnings per share owing to favorable tax adjustments and the absence of significant one-time charges. Overall, the sector demonstrated remarkable resilience despite inflationary pressures, geopolitical uncertainties, and increasing regulatory scrutiny.

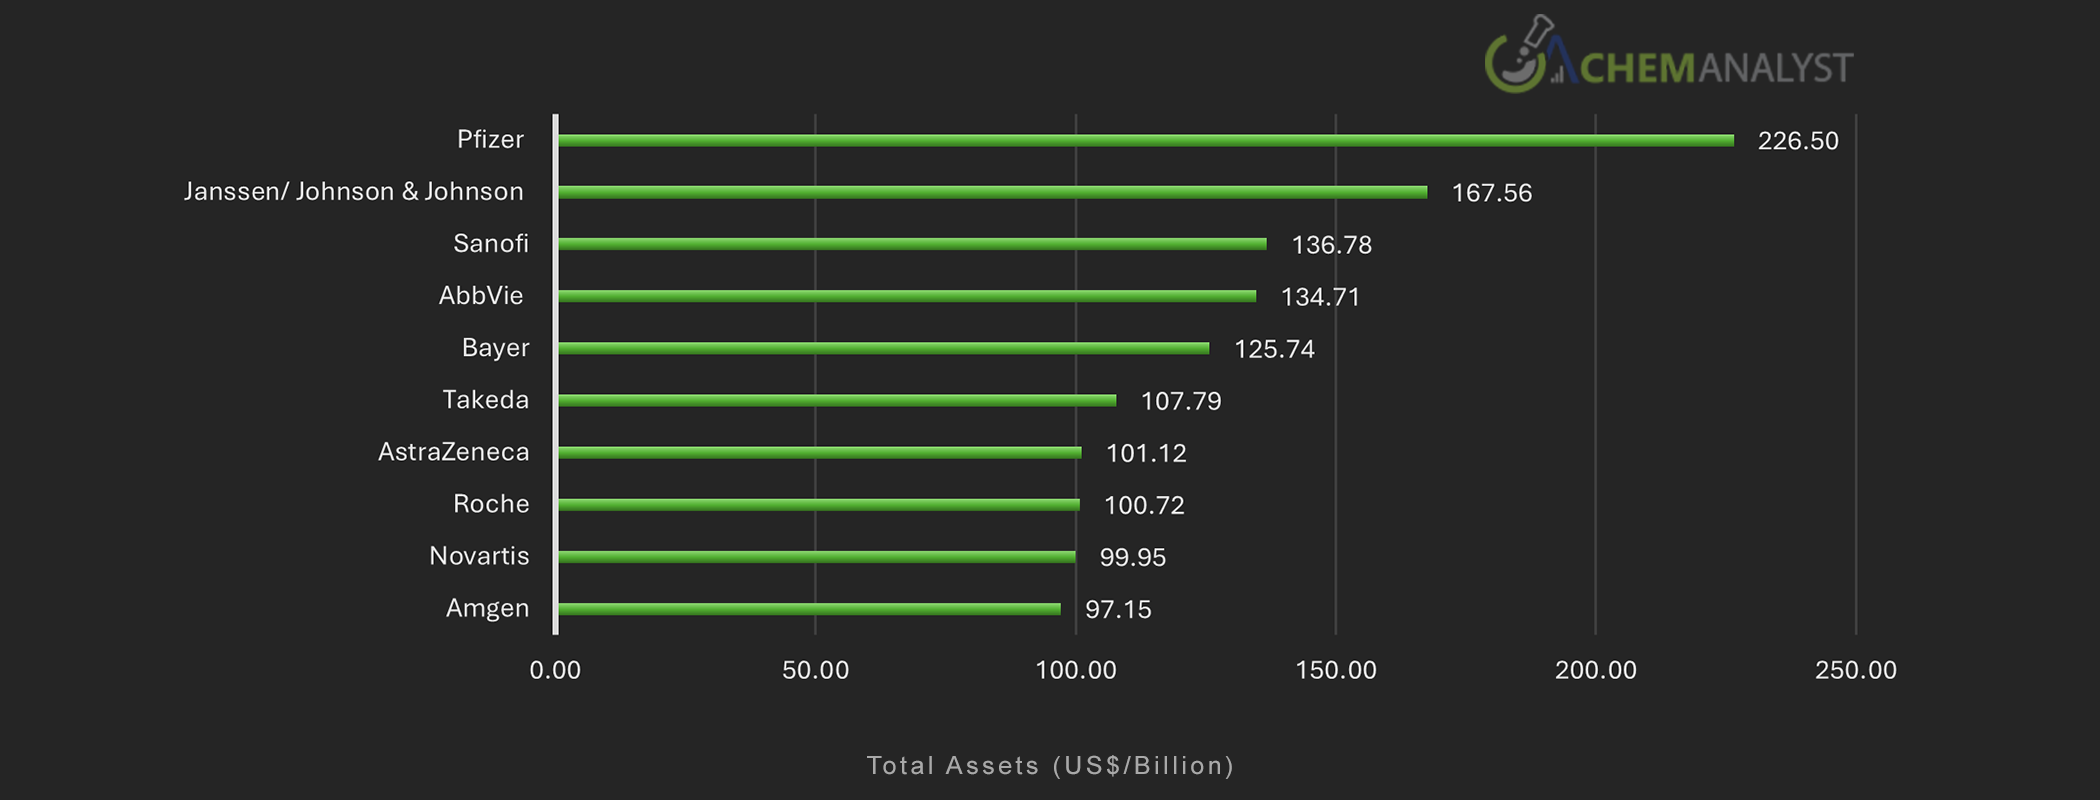
Top 10 Companies by Total Assets

Top 10 Companies by Total Assets

Leading pharmaceutical companies continued to strengthen their balance sheets in 2025 through acquisitions, strategic investments, cash accumulation, and continued expansion of manufacturing and research infrastructure. Johnson & Johnson maintained the industry's largest asset base, reporting total assets of approximately USD 199.2 billion, reflecting the effects of acquisitions and higher cash reserves. AstraZeneca, Eli Lilly, and Novartis reported total assets of USD 114.1 billion, USD 112.5 billion, and USD 110.9 billion, respectively, while Roche maintained total assets of approximately CHF 100.7 billion despite modest declines arising from currency fluctuations.

Amgen reported total assets amounting to USD 90.6 billion, while Bayer maintained assets of approximately EUR 90 billion, supported by its diversified pharmaceutical, crop science, and consumer health operations. Novo Nordisk significantly strengthened its financial position, reporting total assets of DKK 542.9 billion, representing an increase of more than 16% compared with the previous year. GSK reported total assets of GBP 61.1 billion, while Gilead Sciences maintained assets of approximately USD 26 billion. Financial data relating to the total assets of Pfizer, Sanofi, AbbVie, and Bristol-Myers Squibb were not available in the reported figures. Nevertheless, the industry as a whole continued to maintain strong balance sheets, enabling companies to pursue acquisitions, expand manufacturing capabilities, and support long-term research initiatives.

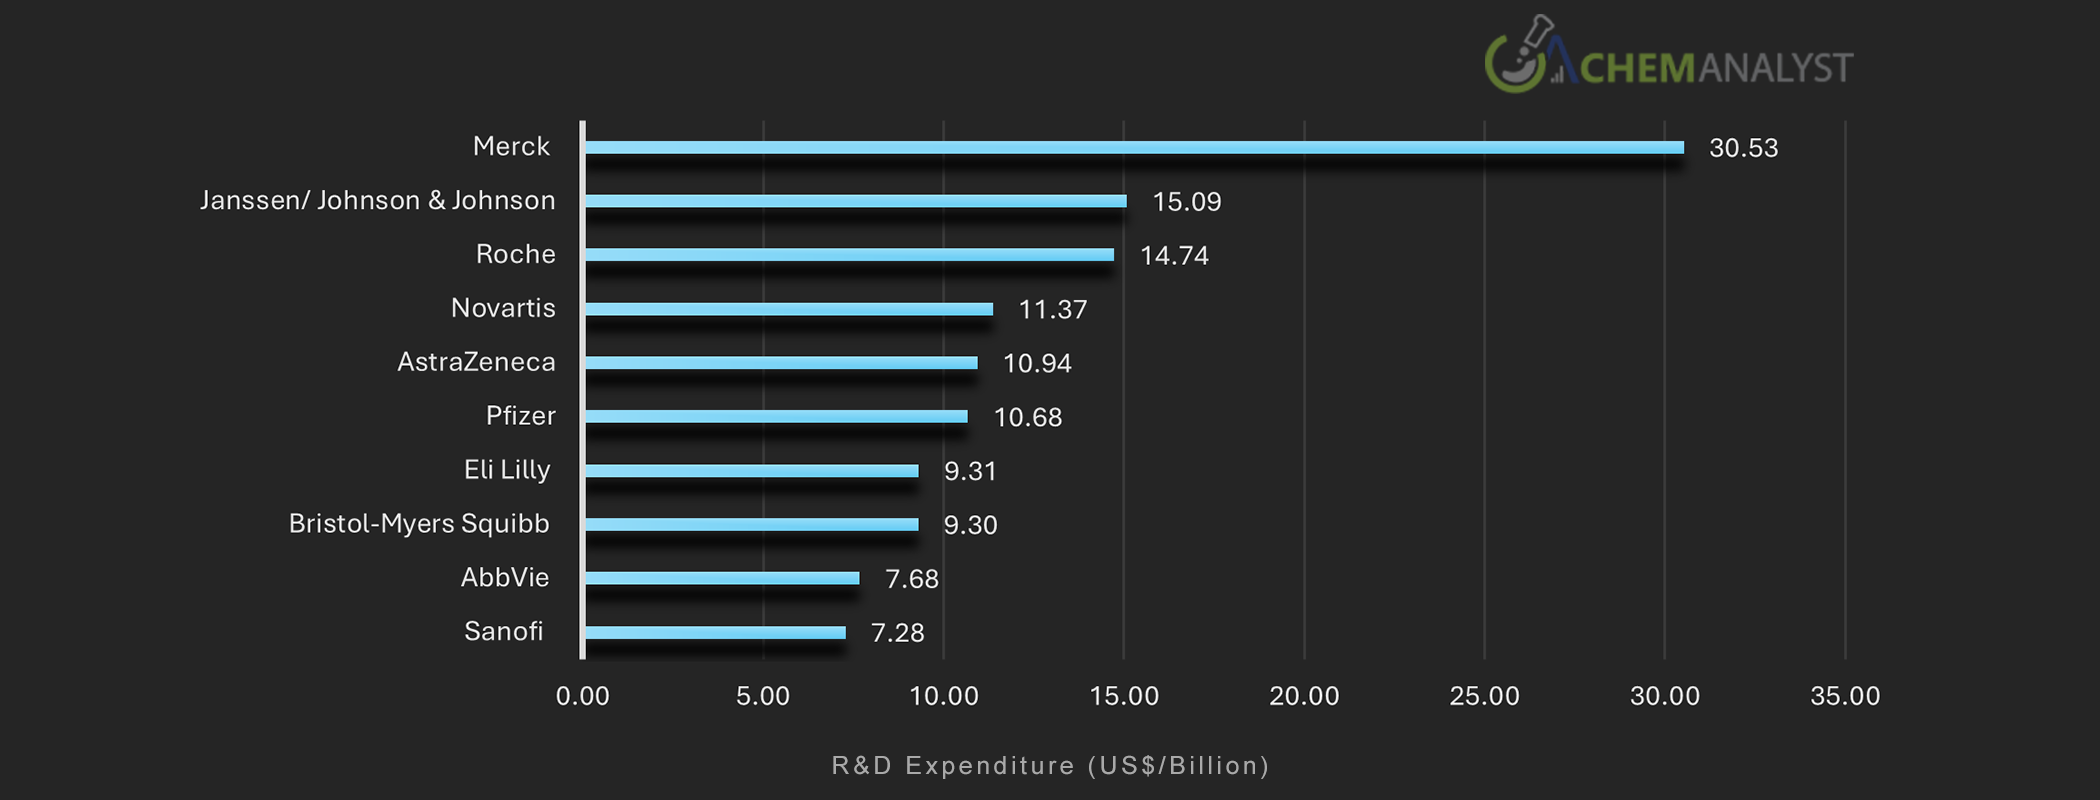
Top 10 Companies by R&D expenditure

Top 10 Companies by R&D expenditure

Investment in research and development remained one of the defining characteristics of the pharmaceutical industry in 2025, as companies sought to strengthen their product pipelines, accelerate clinical trials, and expand into rapidly growing therapeutic areas such as oncology, immunology, gene therapy, and obesity management. Johnson & Johnson and AstraZeneca reported the highest research expenditures among the companies considered, allocating approximately USD 14.7 billion and USD 14.2 billion, respectively, toward innovation and product development. Eli Lilly increased its investment by more than 20%, reaching USD 13.3 billion, as the company accelerated the development of next-generation obesity and diabetes treatments.

Likewise, Roche, Novartis, and Pfizer invested approximately CHF 12.2 billion, USD 11.2 billion, and USD 10.4 billion, respectively, in research activities. Bristol-Myers Squibb and AbbVie reported expenditures of approximately USD 10.0 billion and USD 9.1 billion, respectively, while Amgen allocated USD 7.3 billion to support clinical trials and biosimilar development. GSK, Gilead Sciences, and Sanofi reported research expenditures of GBP 6.3 billion, USD 5.8 billion, and approximately EUR 2.3 billion, respectively. Meanwhile, Novo Nordisk increased its investment significantly, reporting research and development spending of DKK 52.0 billion, primarily to strengthen its diabetes and obesity portfolio. Although Bayer did not disclose a specific figure, the company continued to make substantial investments in pharmaceutical and agricultural biotechnology research. Overall, sustained research spending reflected the industry's commitment to innovation and its efforts to address evolving healthcare needs while maintaining long-term competitiveness.

Research Methodology

The methodology for analyzing and ranking the world's top pharmaceutical manufacturing companies in 2025 involved a comprehensive and systematic approach. Initially, a thorough list of major global pharmaceutical manufacturers was compiled, covering a wide range of companies from various regions and market segments. The primary source of data for this analysis was the annual reports of these companies for the year 2025, with a particular focus on their consolidated balance sheets and financial statements. The cornerstone of the ranking system was the companies' net revenue or sales figures for 2025. This metric was chosen as the primary ranking factor due to its clear representation of a company's market presence and overall financial performance. It's worth noting that the financial reporting periods varied slightly among companies, with some publishing reports for the fiscal year ending in 2025, while others for March 2025. To accommodate these differences, the methodology allowed for flexibility in the reporting periods while maintaining a focus on the most recent and relevant financial data. The scope of the report extended beyond purely pharmaceutical companies to include businesses with diverse operations, such as those involved in chemical manufacturing or medical equipment production. However, to maintain focus and relevance, the ranking primarily considered the performance of their pharmaceutical drugs segment when evaluating these multifaceted corporations.

A key aspect of the methodology was the evaluation of year-over-year performance improvement. This was calculated as the percentage change in key financial metrics from 2022 to 2023. The analysis incorporated several crucial financial indicators to provide a holistic view of each company's performance:

  1. Sales or revenue: Reflecting the company's market performance and growth.
  2. EBIT (Earnings Before Interest and Taxes) or Business Operating Income: Indicating operational profitability.
  3. R&D (Research and Development) expenses: Highlighting investment in innovation and future growth.
  4. Capital expenditure (CAPEX): Showing investment in long-term assets and infrastructure.
  5. EBITDA (Earnings Before Interest, Taxes, Depreciation, and Amortization): Providing insight into operational efficiency and cash flow.

For each of these metrics, the percentage difference between 2025 and 2024 was calculated, offering a clear picture of year-over-year growth or decline. This multi-faceted approach allowed for a nuanced understanding of each company's financial health and strategic positioning.

Note: It's important to note that in some cases, certain financial indicators had to be omitted from the analysis. This was due to inconsistencies in how different companies reported their financials, with some metrics not clearly presented in annual reports or press releases. This limitation was carefully considered to ensure that the analysis remained fair and consistent across all companies. Also, to create a level playing field for international comparison, all financial figures were converted to Million/Billion US dollars (US$). The conversion rate used was the average of 31st December 2025, ensuring that all companies were evaluated on the same currency basis, regardless of their home country or primary operational currency.

Disclaimer

The information provided in this ranking is intended to be informative and should not be relied upon as the sole factor in making any financial decisions. It is important to note that each country may have its own unique financial reporting regulations and that companies may use various methods to present their financial performance. Therefore, discrepancies in reported values may occur. While every effort has been made to generate this ranking using the most appropriate and relevant approach, any suggestions or feedback to improve its accuracy are welcome.

Get Real Time Prices